For performing elemental analysis by x-ray photoelectron spectroscopy, I needed to integrate and find the area under the peaks in some spectra. One approach is to fit each peak with a Gaussian function and use the area of the Gaussian. For some convoluted peaks, I wanted something simpler. I wanted to get the total area under each peak without fitting it in any way.
I use QtiPlot almost exclusively for plotting and fitting (fityk is my other go-to program) and one of the menu options for plots is Analysis->Integrate. That option brings up a tiny dialog where you can select the curve and range over which to integrate.
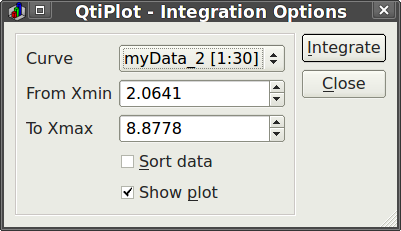
In the results log, an area is printed for the integrated curve. I wasn’t sure what QtiPlot was doing so I did an experiment with a simple set of data. I now know conclusively the algorithm used by QtiPlot and am able to replicate it in a spreadsheet program. I use LibreOffice Calc, but the instructions here should work in Excel as well.
Given a set of n points, P1 through Pn, a curve is generated by connecting each point with straight lines.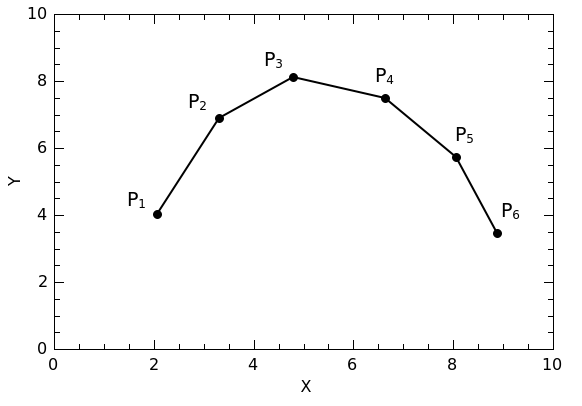
The area under the curve between two points, (x1, y1) and (x2, y2), is a trapezoid with area A = 1/2 |x1 – x2| (y1 + y2).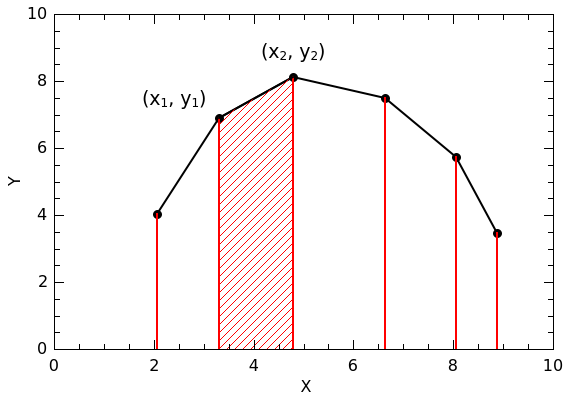
To find the area under the curve defined by a set of points, QtiPlot iterates through the points from P0 to Pn-1. For each point Pi, it calculates the area using Pi as (x1, y1) and Pi+1 as (x2, y2) and sums all of the trapezoid areas.
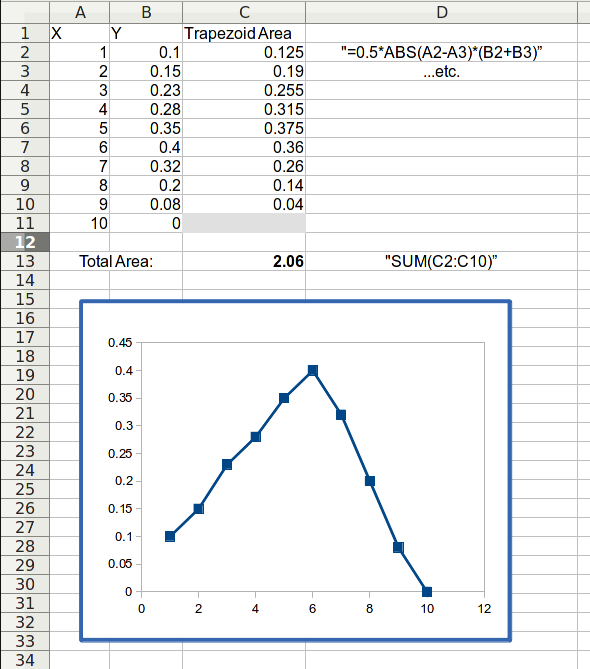
The above process is easy to replicate in LibreOffice Calc (or Excel) with the x,y data that define the curve. Assuming the x coordinates are in column A starting at row 1 and the y coordinates are in column B starting row 1, the areas of the individual trapezoids can be generated in column C. The formula in the first row is: “=0.5*abs(A1-A2)*(B1+B2)”. That formula is then copied down column C in all of the rows but the last. Finally, the areas are summed to give the total area under the curve.