Managing an iPod Shuffle (2nd gen.) in Linux

I have an old second generation iPod Shuffle (model A1204). When I dug it out of storage it wouldn’t play any songs. I plugged it in to my mobile desktop running Debian and verified the file system could still be read. I transferred all of the existing songs off of the shuffle using Thunar and its handy renaming feature. In order to manage the tracks (i.e. add and remove songs) I needed a piece of Linux software with that capability. Unfortunately, the popular options, Banshee, Rhythmbox, and Amarok would all require that I update a significant amount of my system (mostly gnome and everything that depends on it). The best lite application I could find was gtkPod.

I first tried adding and removing tracks with gtkPod but kept getting errors. The process for adding songs was not straightforward and I couldn’t figure out how to fix those errors. Even when I got songs transferred to the device, it refused to play. It would only flash alternating green and orange indicating it couldn’t find any music. The database file wasn’t being written properly. So, gtkPod alone would not suffice (I may have an unsupported model, I couldn’t find it in the list of devices).

The solution relies on a python script “iPod shuffle database builder” which can be found on sourceforge. I used version 1.0-rc1. My process for adding tunes to the shuffle is now this (starting from scratch):

  1. Use file manager (Thunar) to permanently delete all files from the shuffle.
  2. Open gtkPod and use it to recreate the iPod Shuffle directories only.
  3. Use file manager to copy songs from desktop to Shuffle. Songs are stored in device root or under any arbitrary file hierarchy, just not in the normal /iPod_control/Music directory that iTunes uses.
  4. The python script mentioned above, named “rebuild_db.py” is copied to the root folder of the device.
  5. The python script is executed from the root folder of the device.

That’s it. Once the script rebuilds the Shuffle’s database it can be ejected and used as normal. Easy. Apple take notice.

How to change “about:home” to anything in Firefox (Icecat, Iceweasel)

Before reading, please note that I’ve written this post with respect to Icecat 17.0.1 which is a rebranded version of Firefox. I can’t guarantee that things will work the same with Firefox or Iceweasel (another rebrand) or other versions of any of these Mozilla browsers.

The concept of a home page is not well defined in Firefox. In Edit->Preferences there is a Home Page setting. When Firefox starts, this is the url that will be displayed. But it’s not the url displayed when a new tab is created or when visiting about:home. Those are two other, independent settings. The first is set from the about:config screen by changing the preference browser.newtab.url. It’s also necessary to set browser.newtabpage.enabled to false. The latter is not easily changed. There is no preference to change it.

The about:home page is a static page included in the Firefox distribution. In can be found in the file omni.jar (or omni.ja in my distribution). The exact location of this file will depend on the distribution, the operating system, and probably the Firefox version. It’s probably easiest to find it by doing a search of your file system. One my try entering “chrome://browser/content/findme” in the address bar of a Firefox tab. The resulting error message might indicate where omni.jar is to be found.

Once located, the omni.jar file can be opened and it’s contents browsed and edited. I use fileroller on my Debian based pc to browse the contents of the archive. Inside the archive, you need to find the aboutHome.xhtml file. In my version of Icecat (17.0.1) it is located within the archive at /chrome/browser/content/branding/. If you don’t have a rebranded version of Firefox, you might find it at /chrome/browser/content/browser/abouthome/.

Open this file for editing. Within the <head> element of the xhtml page, simply add the following script tag:

<script>
window.location.href = "https://www.startpage.com";
</script>

Whenever about:home is accessed, the page will be automatically redirected to whatever url is set in the quotation marks. You can test this by typing “about:home” in the address bar of a Firefox tag. This shouldn’t require that you restart Firefox in order to work.

Playing around with the omni.jar file turns out to be a lot of fun. With my current configuration, I am able to browse the contents of the jar file using Firefox itself by typing in the following in the address bar of a tab: “jar:file:///home/Files/Programs/icecat-17.0.1/omni.ja!/”.

It also seems possible to access some components directly. For example, entering “chrome://browser/content/browser.xul” in the address bar of a tab, appears to load another instance of Firefox within that Firefox tab. It’s like a new Firefox window all contained within a tab. Very cool.

Screenshot - 03202014 - 03:35:10 PM

Dome light triggered RGB LED footwell lighting in a 2010 Honda Fit

mosaic

I recently installed LED footwell lighting in a 2010 Honda Fit. The LED’s are driven with a PWM dimmer/controller that uses potentiometers to manually adjust the brightness of each of the RGB channels. Any combination of red, green, and blue is possible. The LED’s match the operation of the dome light switch and come on for the same events, e.g. when the door is opened. They also come on when the dome light switch is set to ON. In order to allow the LED’s to fade with the dome light, it was necessary to make a small modification to the dimmer/controller.

During installation I remembered to take lots of photos. I made an instructable with complete details that can be found at the following link:

http://www.instructables.com/id/Dome-Light-Triggered-LED-Footwell-Lighting-for-a-2/

High quality figures with QtiPlot and GIMP

To make figures for publications and for general plotting I use Ion Vasilief’s QtiPlot. I find it allows excellent control of 2D plot formatting. By customizing some settings, it’s easy for me to import ASCII data from almost any file format which is important to me since I use a variety of instruments and each one exports its data in a different way. It has a fair set of data analysis tools, too, and is extensible using python, something I’ve written about before (see here and here).

Despite its many advantages, I was disappointed in the graph export implementation. For everyday general plotting and printing, I’ve been content to export my figures in the png (portable network graphic) format. Research journals, though, require plots to be created at high resolutions, usually 300 dpi or above. The export graph dialog allows export to many formats and allows one to set the desired size and resolution. For me, these settings do not work as expected and prevents me from directly exporting high resolution figures. I’ve developed a simple “work-around” to accomplish this so that I can continue using QtiPlot as my primary plotting software.

Below I describe the problems I’ve encountered with exporting graphs in QtiPlot and the solution I’ve found. Please note, I’m currently using version 0.9.8.9 svn 2288. The bugs and solution presented my not be applicable to newer versions.

Problems with QtiPlot’s Export Graph Features

I haven’t bothered to browse the source code, so I won’t attempt to guess at the root causes of the “bugs” I’ve found. Instead, I’ll focus on describing what I see as the expected behavior and the actual behavior from QtiPlot. I will illustrate the problems with a few quick examples.

Example 1:

Screenshot - 03092014 - 11:26:50 AM

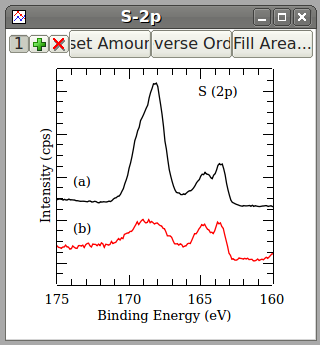
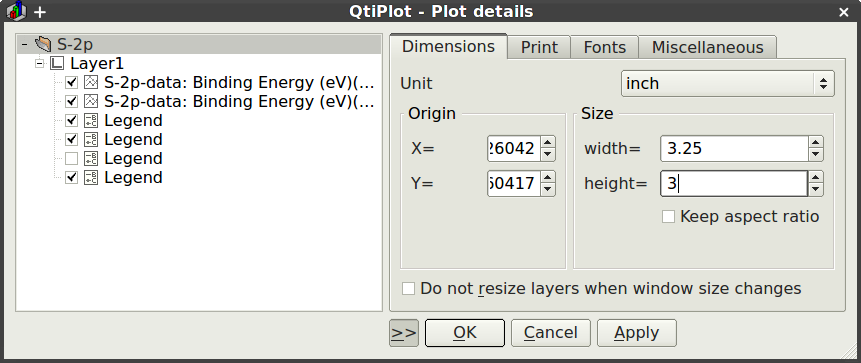
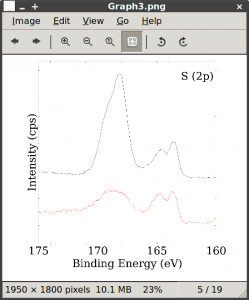
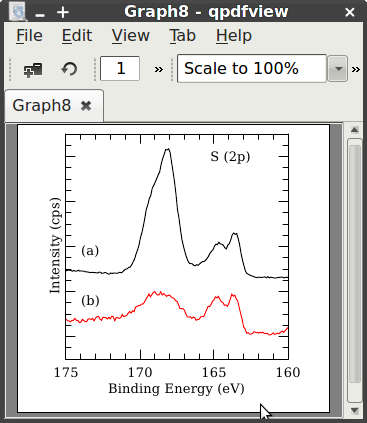
Let’s say I intend to produce a figure that is 3.25 inches wide (standard column width for ACS journals) and 3 inches tall. To ensure a high quality figure, I want to produce my figure at 600 dpi. That means the final image, if rendered to a raster type format (e.g. bmp, jpeg, or png) will have a final size of 1950 x 1800 pixels².

In QtiPlot, I make a new graph window and set its dimensions to 3.25″ x 3.5″. Why 3.5″? It turns out, the window size does not equal the final image size. Some of the window is occupied by the title bar, etc., and not by the graph. I’ve found that the final graph height will be about 1/2 inch less than the window height. The width does not have an easy relationship (though it does follow a y = mx + b relationship).

Screenshot - 03092014 - 11:25:40 AM

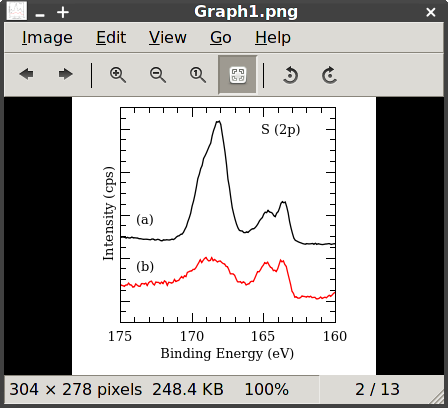
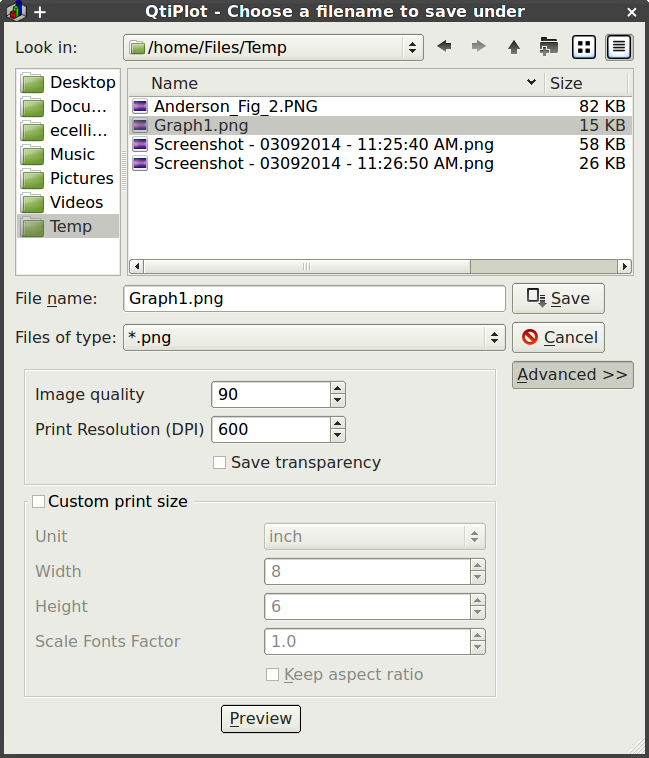
I add my curves and apply any desired formatting. Now I export the graph. I’ll try the png format first. The Export Graph dialog presents you with three options for the png format. I set the image quality to 90 and the resolution to 600 dpi. I’m ignoring the transparency setting for this plot. I save the graph.

Screenshot - 03092014 - 11:28:08 AM

Screenshot - 03092014 - 11:32:07 AM

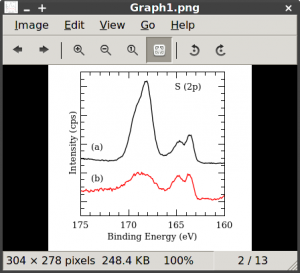
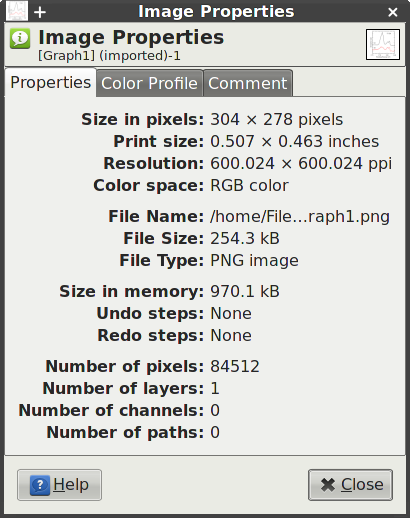
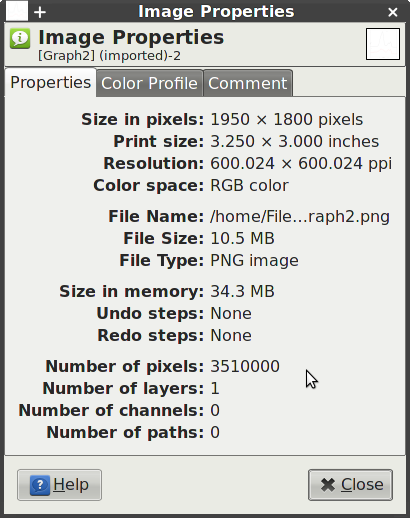
The exported image seems to look ok, but the size, in pixels, is too small, only 304 x 278 pixels². The GNU image manipulation program, or GIMP, provides more details.

Screenshot - 03092014 - 12:50:40 PM

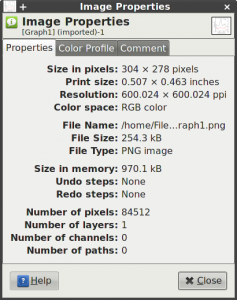
GIMP shows the correct resolution as 600 dpi but notice the image dimensions in inches are not correct. My image is only 0.507 x 0.463 inches². The math works out, though. An image with that geometry at 600 dpi would be 304 x 278 pixels². Perhaps there is an easy fix. On the Export Graph dialog is a second section allowing me to customize the print size. I set the custom size to 3.25 x 3 inches² and re-save the figure.

Screenshot - 03092014 - 11:39:41 AM

Screenshot - 03092014 - 11:40:12 AM

That fixed the size and resolution problem. I now have the correct dimensions in inches and pixels. The only trouble is, the graph is no longer rendered properly. All lines are too thin. All fonts are too small. In the Export Graph dialog, perhaps you noticed the “Scale Fonts Factor” setting. Since 3.25″ is roughly 6.4 times bigger than 0.507″, perhaps I only need to scale my fonts by a factor of 6.4. I make this change and export a new version of my figure.

Screenshot - 03092014 - 11:42:52 AM

This is closer. The fonts are closer to the correct size; the dimensions and resolution are correct. My text for “(a)” and “(b)” have gone missing. The lines and curves are still too thin. There are no other settings to change in the export graph dialog. A solution might be to increase all line thicknesses by a factor of 6.4 and try moving my text around until it exports in the right position. I’ll just say now that this is nearly hopeless. During design, such enormous line widths make your plots unreadable and no one wants to use trial and error to align text boxes.

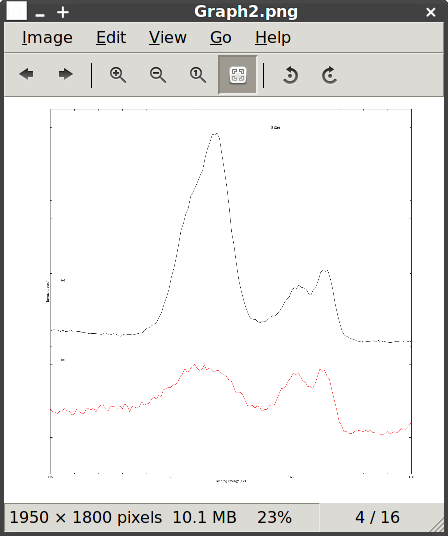
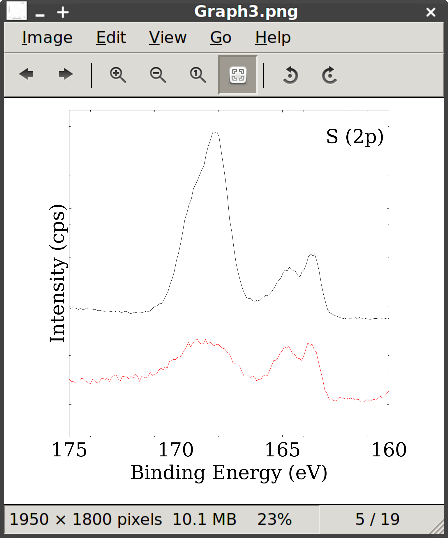
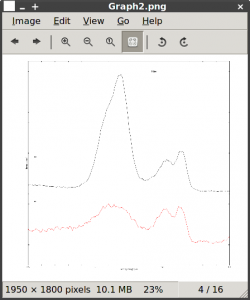
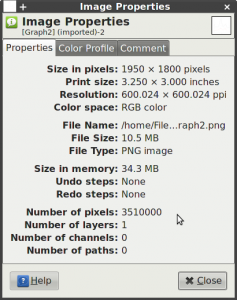
There is one other approach left. My experiments tell me that to get the font and line widths correct, the resolution of the exported image needs to be set near the resolution of the image on the screen. For me, that is 96 dpi. That is, my 3.25 x 3 inches² figure occupies 304 x 278 pixels on my screen. If I want my plot to export at 1950 x 1800 pixels², I should set my graph window size to these dimensions in pixels. Now, in the QtiPlot interface, my graph window is so enormous I can’t see much of it on the screen at one time. But, by increasing my fonts and line thicknesses and exporting to png at 600 dpi with no custom size, I get something very close to what I wanted.

Graph5

This isn’t bad, but makes working with graphs in QtiPlot extremely cumbersome, and there is still some trial and error left in adjusting font sizes and line widths. Also, the file size is 10 MB. This might be reduced by changing the png image quality on export but I haven’t experimented to be sure.

Example 2:

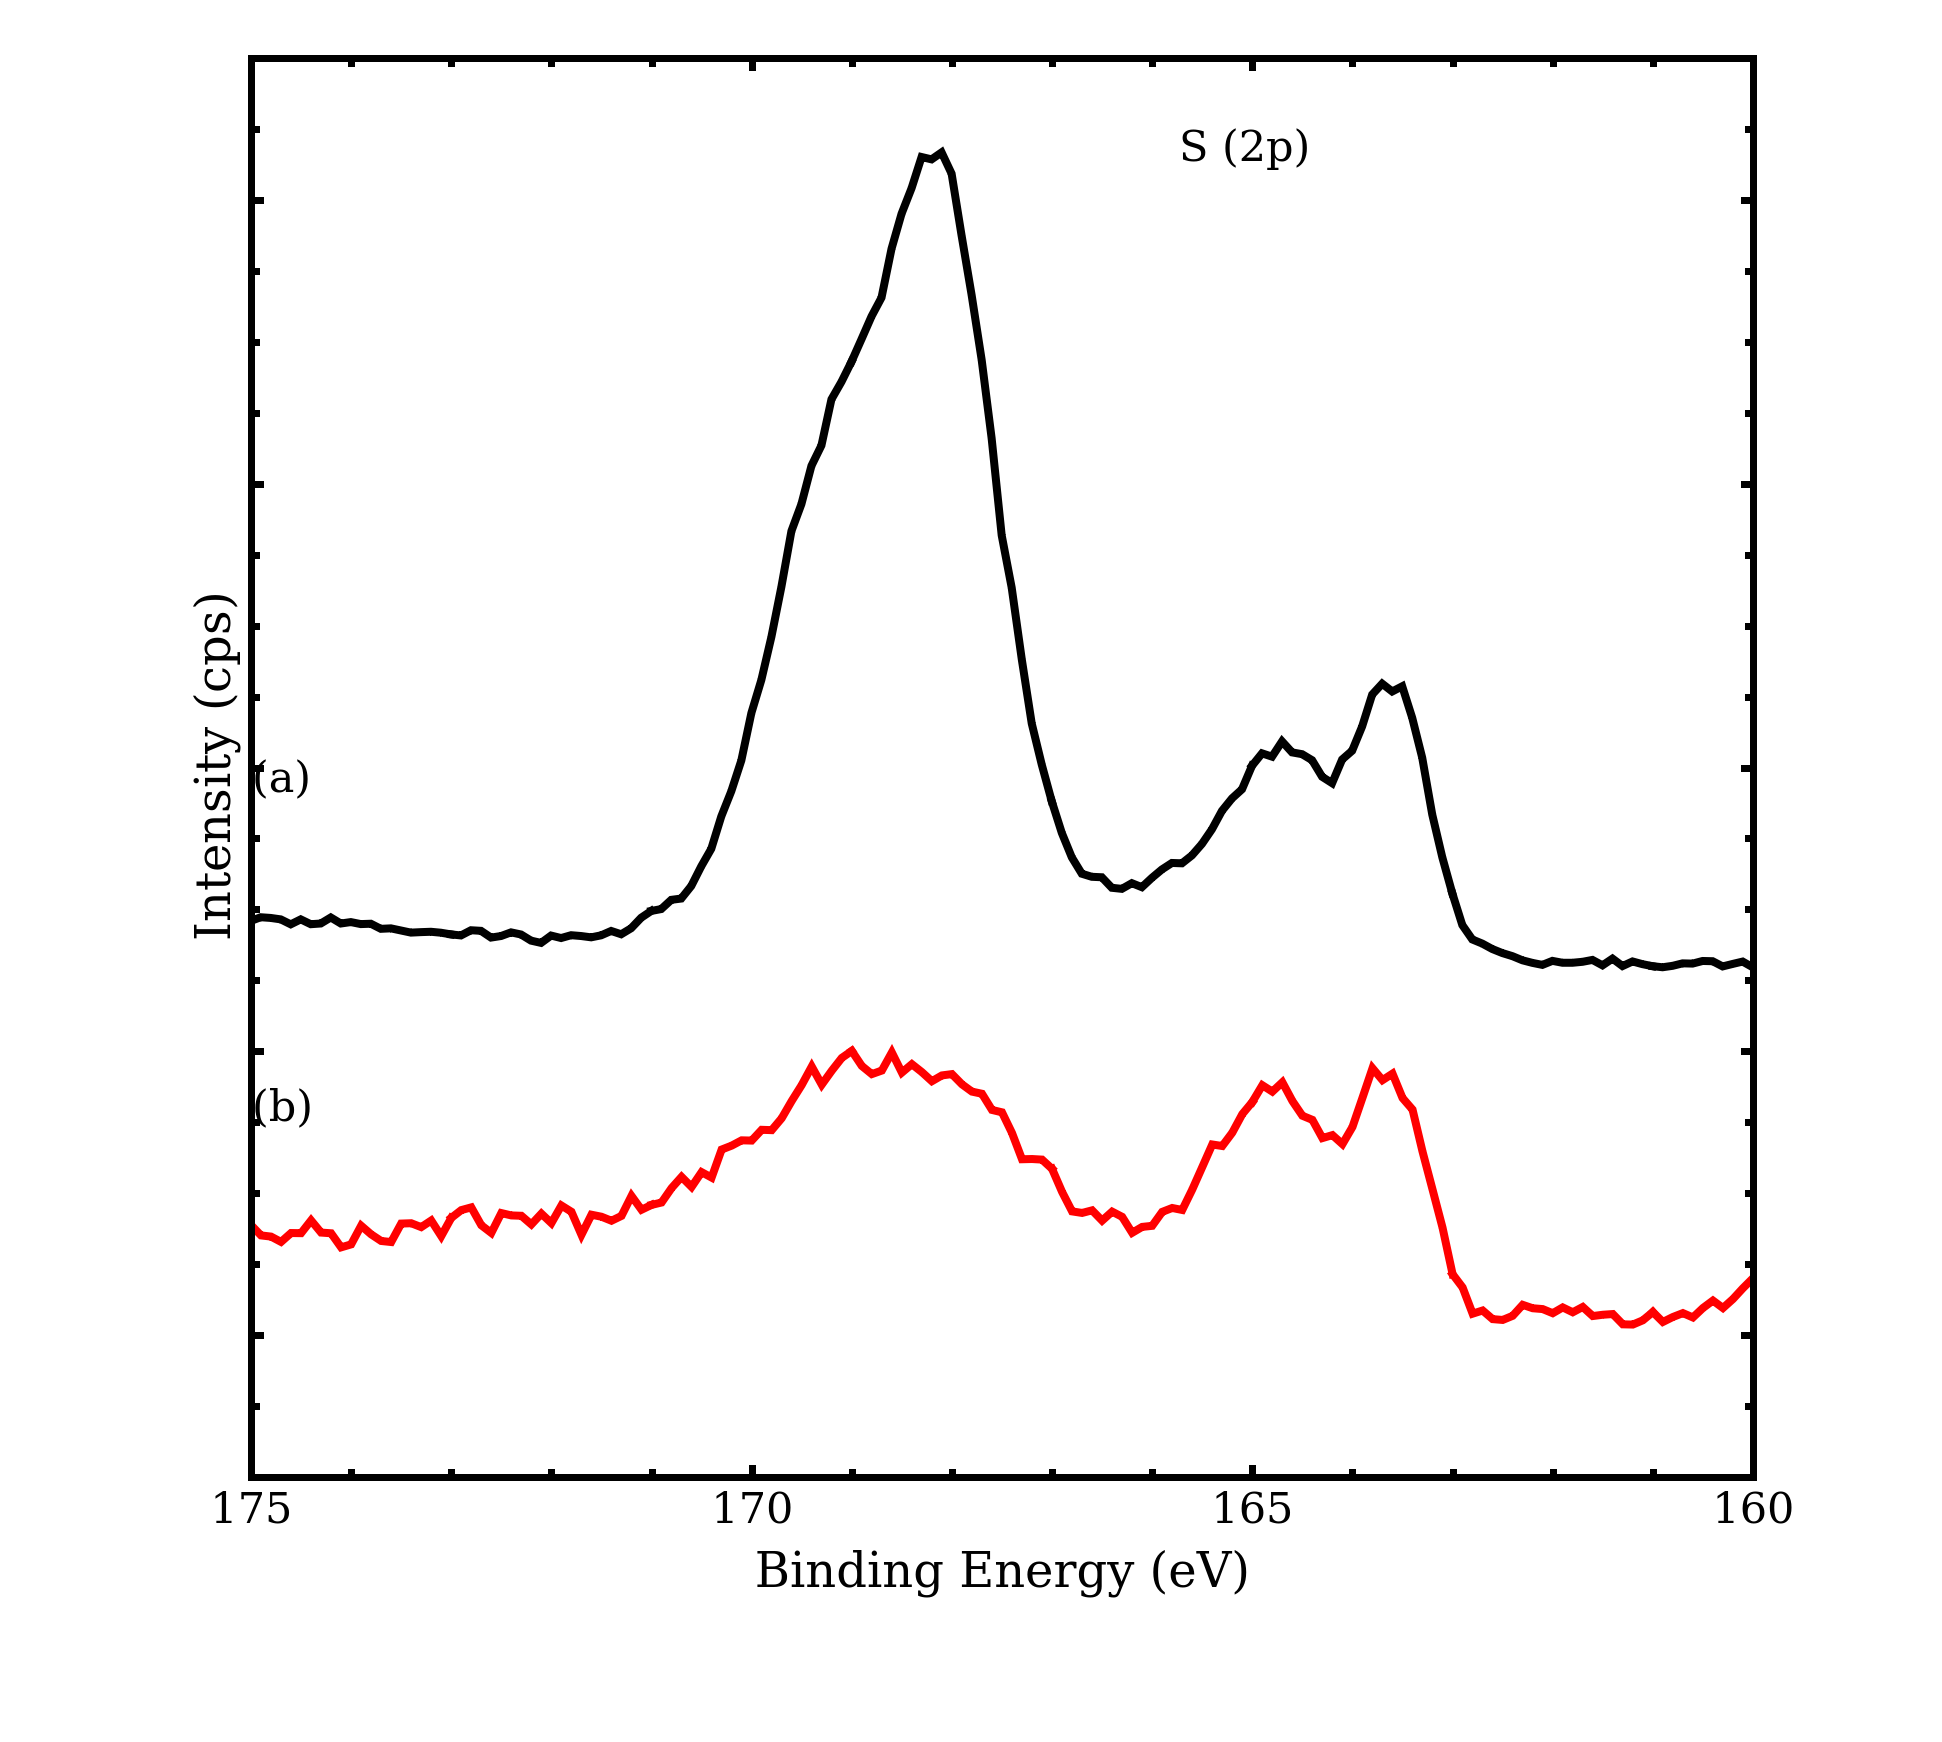
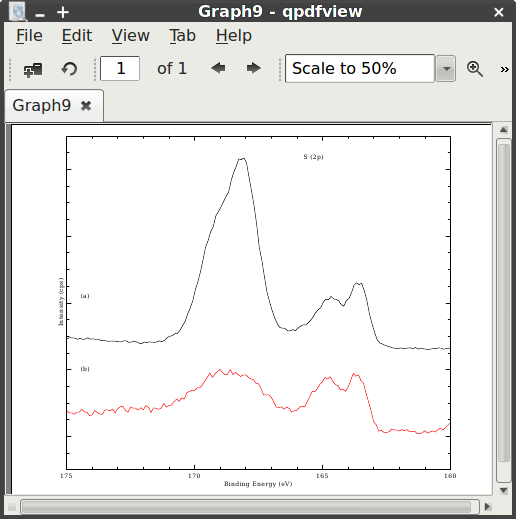
Now let’s say I have my same 3.25 x 3 inches² figure (window height is 3.5″, see above) but this time I try exporting to pdf, a vector image format. The Export Graph dialog lets me choose a resolution and a choice to export in color. A resolution setting doesn’t make sense for vector graphics and indeed, I’ve found it has no affect on the exported pdf. This setting might only apply to figures that contain embedded bitmaps. I set it to 600 dpi anyway and export.

Screenshot - 03092014 - 12:12:30 PM

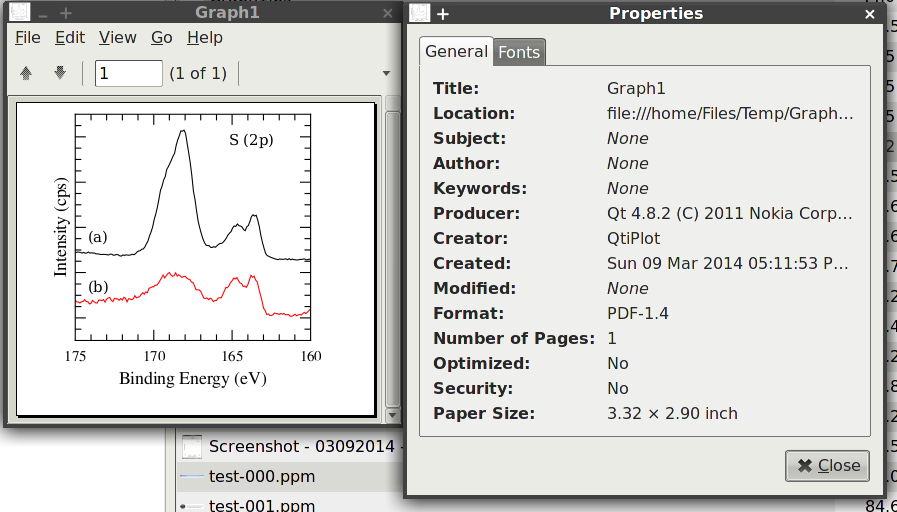
Now we’re talking. The graph, at first glance, looks great. I was able to design my graph with a reasonable window size and didn’t have to tinker with font sizes or line widths. The pdf document dimensions don’t quite match the window dimensions. That’s an easy fix though, I can set the custom size in the Export Graph dialog to tweak it.

Screenshot - 03092014 - 12:15:53 PM

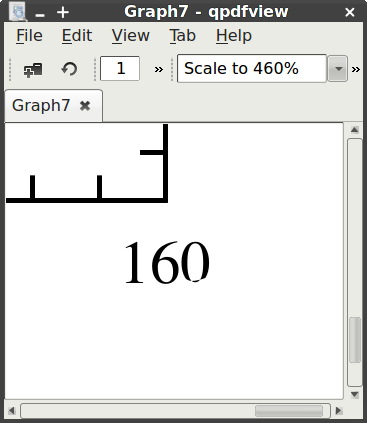
There. I now have the right dimensions. But wait a tick, something seems wrong with those zeros.

Screenshot - 03092014 - 12:17:56 PM

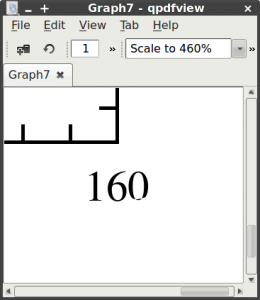
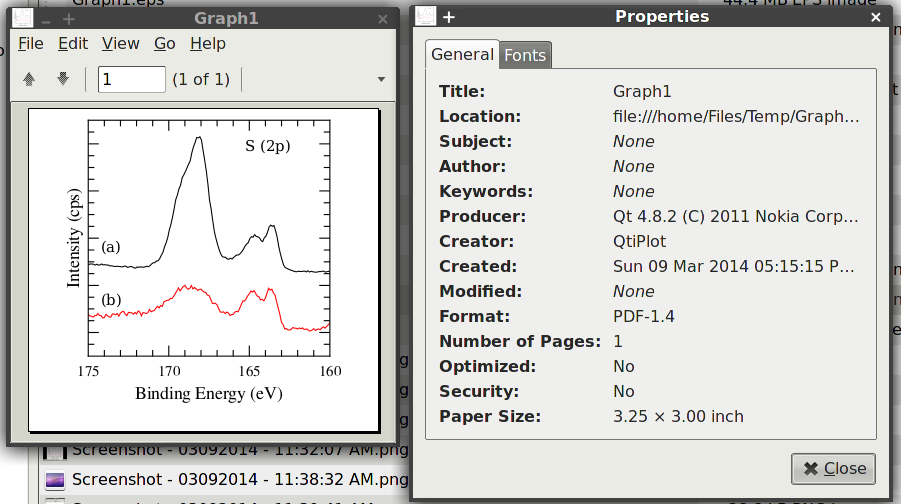
So close! The font choice seems to be the problem. In this case, I’ve been using Free Serif and Free Sans. If I change fonts to Serif and Sans I get a perfect looking figure.

Screenshot - 03092014 - 12:19:47 PM

What about resizing? That is, say I want to have big windows with which to work in QtiPlot, but then export my graphs in a different size? Or, what if I were to export my 3.25 x 3 inches² figure at a custom size of 10 x 8 inches²?

Screenshot - 03092014 - 12:23:21 PM

I’m back to the same problem I experienced with rastered formats. My fonts are too small and my lines too thin.

Conclusions and Solution:

From the above examples I’ve learned the following QtiPlot behaviors concerning designing and exporting graphs:

  1. Graph window dimensions do not equal the final figure dimensions. The final dimensions will be a bit smaller because the non-graph elements of the graph window will be excluded.
  2. To successfully export rastered images directly it is necessary to work with the graph window at the same size in pixels as the desired final image. For example, if I want a 3.25 x 3 inches² 600 dpi final image, my graph window dimensions should be 1950 x 1800 (approximately, due to the first point above).
  3. To successfully export vector images directly (like pdf) it is necessary to work with the graph window at the same size in physical units (inches) as the desired final image. For example, to get a 3.25 x 3 inches² final graph size my graph window should have these same dimensions in inches (approximately, due to the first point above).
  4. In either case, rastered or vector, the custom print size should be set to ensure the desired final size is correct, but note this only works if your graph window dimensions are set very close to the desired final size.

The best approach that I’ve found is to avoid rastered image formats because it is nearly impossible to work with graph windows of the same dimensions (in pixels) as the desired final image (point #2 above) unless you require only very low resolution. Instead, always work with graph windows close with dimensions (in inches) close to the desired final size and export to a vector image format like pdf. This will produce a document with the correct dimensions and an infinite resolution since it is not a rastered format. Check your fonts to be sure they will render correctly and set good ones as your defaults.

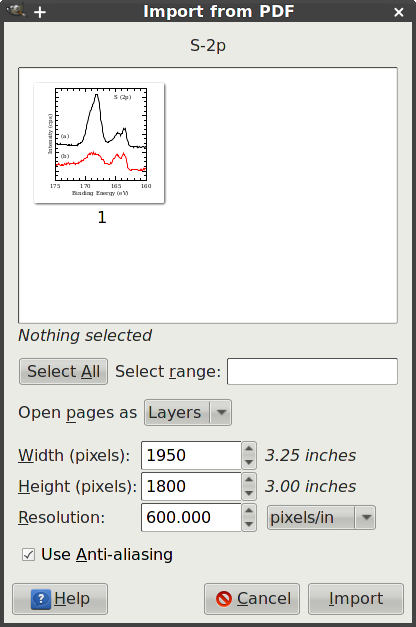
This approach makes great pdf images but sometimes you need a rastered format such as when inserting figures as pictures into word processing documents (e.g. LibreOffice Writer, MS Word). In this case, I use GIMP to open the pdf images and convert to png. Upon opening, GIMP will ask you to specify a desired resolution and based on the document size will render the image with the correct dimensions in pixels.

Screenshot - 03092014 - 12:42:48 PM

Of course, if you require any other kind of resizing, GIMP has this capability too, but it’s best to import the full size image into your word processing document and let the software scale it for you there.


Disable traceback on old WordPress posts and pages

The WordPress traceback/pingback feature is a spam magnet for bloggers, including me. I long ago disabled the feature globally in the Discussion options. It turns out that this only affects future posts. All of the posts and pages written before it was disabled are not affected (WordPress v.3.8.1). I’m tired of moderating spam tracebacks so I looked into a way to disable the feature.

The proper way is probably to use an SQL query as described by this link:

http://www.fatofthelan.com/2013/06/eliminate-pingback-and-traceback-spam-on-old-posts/

Since that involves me remembering how to log into MySQL, the passwords, and associated commands, I wanted something a little quicker, if not dirtier. Another suggestion from the interweb was to delete the php code that handles the tracebacks and automatically generates the comments. This file is called wp-trackback.php and is in the top level WordPress directory. I can’t imagine that I’d ever want to turn this feature back on, but deleting the entire file may be overkill. A rename is probably sufficient, but I worried that this would lead to logs being filled with php errors.

My solution was to kill the script before it got anywhere. A quick perusal shows that after handling the traceback, the script uses a php die() call to exit. I simply slipped one of these in at the top of the file (wp-trackback.php, below the “<?php” initiator) and voila. Any time this script is called it dies quietly and without error. No response is returned to the traceback sender (spammer). If you want to be more creative, just below where the function trackback_response() is defined you can call that function with an error code of 1 and a message for the spammers like this:

trackback_response(1, “Go to Hell. Or Cleveland.”);

On second thought, it might be more effective if you were to explain in your message the detrimental effects of spam on communication via the internet, the associated ethical problems, and the ineffectiveness of spam advertising. Encourage them to change their ways and contribute to a healthy, open exchange of real, meaningful ideas.

I’m sure that can all be said with a few choice four letter words.

One thing to mention: editing, deleting, or renaming the wp-trackback.php file, or any other WordPress php scripts, probably won’t survive an update. The SQL method mentioned above is update-safe.

Batch Table Operations – A QtiPlot plug-in/script

I’ve been taking lots of data at work. Each data file collected has to be imported to QtiPlot as a table and then several columns are added to the table and calculated from the imported data. Some days I have over 100 data sets, which means > 100 tables to manipulate. It was becoming impractical to perform all of the necessary table operations by hand. This script was written to automate the table operations I needed.

Batch Table Operations

To use one simply selects the tables to be affected from the list of existing tables. Then one selects and configures the operation to perform. Finally, clicking the “apply” button will perform the operation on the chosen tables.

As of today (1/30/14) the script allows adding and removing columns based on name, changing column types (x, y, z, etc.), and applying formulas to columns. Obviously, alot more could be done, but at the moment, this fits my needs. As I require more features I will add them. If you would like to request a feature add a comment or send me an email and I’ll see what I can do.

Download:

batchTable.zip

Edit 8/5/14:

I just tried to install this in version 0.9.8.9 of QtiPlot running on Windows 7 but was unable to get the script interface to load. The particular version of QtiPlot installed on the target machine came from an unofficial Windows binary (https://www.cells.es/old/Members/cpascual/docs/unofficial-qtiplot-packages-for-windows) that I’ve used before. That QtiPlot package comes with parts of PyQt4 but not the entire library. As such it is necessary to install both python 2.7 and PyQt4 as well. Then, the …/PyQt4/uic module folder has to be copied into the PyQt4 directory of the the QtiPlot installation.

At least, that was the solution in the past. Now this no longer works. The uic module is found but fails to load. I expect it’s because the version of Qt against which QtiPlot was complied and the version for which the uic module were written are now too different. Or it may be that the version of Python is too new (2.7.8). I got this to work in the past with Python 2.7.5. Anyway, under Windows at least, I no longer expect for the batchTable plugin to be usable because it draws its interface using the uic module I can’t get working. Things should still work on Linux installations. The long term solution would be to rewrite the plugin to use a Tkinter interface instead of Qt thereby removing the dependency problem.

Use inxi to identify temperatures reported by lm-sensors/sensors

With lm-sensors installed and properly configured, the output of the sensors command can be confusing in that it doesn’t identify which temperature is the CPU, motherboard, etc. For example, when run on my system, I get four temperatures reported to me:

ecellingsworth@MD1-LMDE ~ $ sensors
k10temp-pci-00c3Adapter:
 PCI adaptertemp1:        +35.5°C  (high = +70.0°C)

w83627dhg-isa-0290Adapter:
ISA adapter
Vcore:        +1.41 V  (min =  +0.00 V, max =  +1.74 V)
in1:          +0.30 V  (min =  +1.86 V, max =  +0.57 V)  ALARM
AVCC:         +2.72 V  (min =  +2.98 V, max =  +3.63 V)  ALARM
+3.3V:        +2.75 V  (min =  +2.98 V, max =  +3.63 V)  ALARM
in4:          +1.39 V  (min =  +1.78 V, max =  +1.26 V)  ALARM
in5:          +1.58 V  (min =  +0.98 V, max =  +1.78 V)
in6:          +1.79 V  (min =  +0.70 V, max =  +0.51 V)  ALARM
3VSB:         +3.02 V  (min =  +2.98 V, max =  +3.63 V)
Vbat:         +3.07 V  (min =  +2.70 V, max =  +3.30 V)
fan1:        3835 RPM  (min = 1308 RPM, div = 8)
fan2:        3183 RPM  (min = 1240 RPM, div = 8)
fan3:        4115 RPM  (min =  774 RPM, div = 8
)fan5:           0 RPM  (min = 2636 RPM, div = 128)  ALARM
temp1:        +32.0°C  (high = +111.0°C, hyst = -29.0°C)  sensor = thermistor
temp2:        +43.0°C  (high = +80.0°C, hyst = +75.0°C)  sensor = thermistor
temp3:        +92.0°C  (high = +114.0°C, hyst = +114.0°C)  sensor = thermistor
cpu0_vid:    +0.375 V
intrusion0:  ALARM

The first module, k10temp, is related to my motherboard, an ASRock 890GM Pro3. The kernel documentation for k10temp says the following:

There is one temperature measurement value, available as temp1_input in sysfs. It is measured in degrees Celsius with a resolution of 1/8th degree. Please note that it is defined as a relative value; to quote the AMD manual: Tctl is the processor temperature control value, used by the platform to control cooling systems. Tctl is a non-physical temperature on an arbitrary scale measured in degrees. It does _not_ represent an actual physical temperature like die or case temperature. Instead, it specifies the processor temperature relative to the point at which the system must supply the maximum cooling for the processor’s specified maximum case temperature and maximum thermal power dissipation.

So, it’s unclear where that temperature is measured or if it is even accurate. I will be ignoring it here. The second entry comes from module w83627dhg. If you google this you will find that this comes from a WinBond chip found on many different motherboards. The number and type of temperature sensors used and their physical locations depends on how the motherboard was designed and will vary between manufacturers and models. So, to identify “temp1”, etc., one can use a script called inxi. This script can be used to list all sorts of information about one’s system. A Debian package is available on the website and the script is pre-installed in many popular distributions (Mint, Crunchbang, Arch, etc.). The full output looks like this:

ecellingsworth@MD1-LMDE ~ $ inxi -F
System:    Host MD1-LMDE Kernel 3.12.0-031200-generic x86_64 (64 bit) Distro Linux Mint Xfce Edition
CPU:       Dual core AMD Athlon II X2 250 (-MCP-) cache 2048 KB flags (lm nx sse sse2 sse3 sse4a svm) bmips 12023.7
            Clock Speeds: (1) 3005.932 MHz (2) 3005.932 MHz
Graphics:  Card ATI RS880 [Radeon HD 4290] X.Org 1.11.4 Res: 1280x1024@60.0hz            GLX Renderer Gallium 0.4 on AMD RS880 GLX Version 2.1 Mesa 7.10.3 Direct Rendering Yes
Audio:     Card-1 ATI SBx00 Azalia (Intel HDA) driver snd_hda_intel BusID: 00:14.2
           Card-2 ATI RS880 Audio Device [Radeon HD 4200] driver snd_hda_intel BusID: 01:05.1
          Sound: Advanced Linux Sound Architecture Version k3.12.0-031200-generic
Network:   Card Realtek RTL8111/8168B PCI Express Gigabit Ethernet controller driver r8169 v: 2.3LK-NAPI at port e800 BusID: 03:00.0
Disks:     HDD Total Size: 570.1GB (-) 1: /dev/sda WDC_WD2500BEVT 250.1GB
            2: /dev/sdb WDC_WD3200BEVT 320.1GB Partition: ID:/ size: 230G used: 97G (45%) fs: ext4
Sensors:   System Temperatures: cpu: 43.0C mobo: 32.0C
            Fan Speeds (in rpm): cpu: 3183 fan-1: 3750 fan-3: 4115 fan-5: 0
Info:      Processes 184 Uptime 1:01 Memory 724.5/3700.9MB Runlevel 2 Client Shell inxi 1.4.23

Issuing the -s option will give just the sensors information. By comparing the values of the temperatures listed here to those listed from sensors it is possible to determine the identity of the sensors read by sensors. Here I’ve identified the sensor “temp1” reported by sensors is actually my system (motherboard) temp while “temp2” is somewhere on or near the cpu. The value of “temp3” suggests that no sensor is actually installed to this input on the WinBond chip so I can ignore it. I’ve seen other configurations that label it as AUX or a case temperature. Regardless, with the identities in hand, it’s possible to setup a proper sensors.conf configuration or to configure the output displayed in panel applets that depend on lm-sensors.


panel screenshot showing sensors


*Edit 03/13/14: In case you’re wondering, yes, that 3.3 V rail is WAY low. I later discovered this was the cause of frequent freezes on booting and upon plugging in USB devices. Why is the 3.3 V rail low? I have a loose wire on the motherboard power connector. One of the more difficult symptoms I’ve ever had to diagnose for sure.

Extract Y at X – A QtiPlot plug-in/script

I’ve written and posted a QtiPlot plug-in/script (python) I call “Extract Y at X” that extracts the y-values at a given x-value for a series of curves contained in a graph and generates a new table with those values.

The files can be downloaded using the link below. The .zip file contains three files: the script (.py) file, an xml file defining the Qt inteface (.ui), and a README file. Refer to the README file for notes on installation and use.

I wrote this script to analyze a large group of datasets that I had collected. Each dataset was measurement of current as a function of voltage for a device I had constructed and each was collected at a different temperature. In a single dataset the current grew exponentially and across datasets the current grew exponentially with temperature. In order to quantitatively determine how the current changed with temperature I needed to extract the current at some voltage from each dataset. The usual way to do this is to look through the data manually in each dataset and find the point I needed, e.g. the current at +1 V for each dataset. Given that I had so many datasets, it was useful to write a script to do this for me.

Download:

extractYatX.zip

Update 7/18/14:

I found and fixed a bug that limited the number of extracted points to 30.

Update  8/5/14:

As described in another post this plug-in may not work in Windows versions of QtiPlot without the proper dependencies satisfied. The trouble is not the script itself but its reliance on the uic module of Qt which may not have been packed with a particular QtiPlot version when it was compiled and is therefore unavailable to the script. Linux users should be fine, so long as Qt libraries are installed.

Replacing the Edscort’s broken wiper switch

Eventually the Edscort will have its own page, but until then, a small introduction is in order. The Edscort is a 1998 Ford Escort ZX2. We have a long storied past and I have no plans to change vehicles ever. So, when something breaks on the Edscort, and it is something necessary for continued safe operation, it gets fixed. This post details how I went about repairing a broken wiper switch.

slider top view slider bottom view

It’s not important how the switch broke, but it involved significant force being applied to the long wiper switch handle protruding from the steering column. The leverage broke the small brown plastic component inside the switch housing as well as the plastic handle itself. Initially I was able to “plastic weld” the brown piece back together and rejoin the the two pieces of the plastic handle by screwing them into opposite ends of a hex nut coupler. Eventually though, the plastic weld gave out and the switch was inoperable again. I would have to do a complete rebuild.

contacts inside switch housing

contacts outside switch housing

By studying the inside of the switch I was able to determine that the small brown plastic piece rotates to make and brake the connections in the following manner:

  • OFF = 5 + 6(4)
  • VARIABLE = 4(6) + 5, 1 + 3
  • LOW = 3 + 4(6)
  • HIGH = 2 + 3

Where the numbers refer to the contacts as shown in the photos and diagram. Using a multimeter I determined that contacts 4 and 6 were electrically connected, as were contacts 3 and 8. This would prove useful as it reduced the number of wires I needed from 10 to 8, the same number found in a length of CAT5 cable. Because there are four settings, I would need at least a 4-throw switch. I ended up ordering a 3-pole-4-throw switch from ebay. It would turn out that a 2-pole-4-throw switch would have worked as well, but I think the 3-pole switches are more common. But note: if you order a rotary switch, do yourself a favor and get one that comes with a knob. I didn’t and regretted it later.

diagram

The diagram above shows how the connections were made to the rotary switch. There are two more contacts on the outside of the switch housing that originally ran through the middle of the wiper switch all the way to the turn knob on the end. The turn knob is simply a 500 Ω variable resistor. I opted to replace this with a 500 Ω potentiometer (got a knob this time!).

The spring contact inside the switch housing connects contacts 7 and 8(3) and activates the spray wash. I wired these to one circuit of a two position momentary switch (SPDT?). The switch has three contacts which are all disconnected in its un-pressed position. When the rocker is pressed one way, it connects the middle contact and one of the end contacts. When pressed the opposite way, it connects the middle contact to the third contact.

There is one remaining function of the wiper switch that I haven’t mentioned. When it was operational and the handle was pushed up, the wipers would come on at their highest speed momentarily.

  • MOMENTARY HIGH = 2 + 3(8)

Since contact 3(8) was already used in the momentary switch for the wiper spray, all I had to do was connect contact 2 to the third and unused contact of the two position momentary switch. Now, when pressed one way the sprayer would activate. When pressed the opposite way, the wipers would come one momentarily. In practice this worked, though there is a slight delay before the wipers come on and the speed isn’t as high as one would expect. I’m sure this is because the rotary switch is in the on position. In other words, I have the MOMENTARY HIGH position wired as follows:

  • MOMENTARY HIGH = 2 + 3(8), 5 + 6(4)

I decided its function was good enough. If I really need high speed I can turn to that position on the rotary switch rather than use the momentary rocker switch.

wired up

With everything working I had to find a way to mount everything to the steering column. I wasn’t able to mount the switches directly to the plastic housing around the column because it fit so tightly (no space inside). I had to mount everything externally. I opted to use the plastic lid of a jar of peanuts because it had the right depth. I used drywall screws to screw the jar onto the steering column’s plastic housing. The CAT5 wire was a good choice because it was relatively thin. There was no extra room for fat wire.

Disappointingly, I found that my momentary switch was to big to be mounted directly to the steering column housing. I ended up cutting a hole through the housing to run the wires and then hot-gluing it flat to the top of the housing. It’s ugly but should work (at least until the summer heat deteriorates the hot glue). Eventually I will replace this switch with a much smaller (less tall) version and mount it directly to the steering column housing. Actually there is probably enough room left on the red plastic lid to mount some tiny push button switches, though it might be a challenge to find ones with high enough ratings.

in place - side view

The final product is shown mounted in the Edscort. You’ll see that for the time being I’ve had to resort to jamming a washer in the slot of the rotary switch until I can find a knob that will fit. But hey, it works, and there is no long wiper switch handle to get in the way of things.

An improved key-reader library for the SainSmart LCD Keypad Shield (for Arduino)

The LCD Keypad shield from SainSmart is a bargain. For ~$8 (and free shipping, at the time of this post) you get 32 character (16×2) blue/white LCD panel with a built-in keypad with 5 momentary switches. This provides a quick solution for interaction with Arduino projects. To control the LCD part of the shield, one can use the Arduino supplied LiquidCrystal library (included with Arduino IDE). In the Key_Grab demo (v. 0.2) on the SainSmart website is included a library, DFR_Key, for reading which keys are pressed on the keypad. However, the library is not written well. This post describes both the problem and the solution.

First, a little background is necessary about how the keypad signals a key is pressed. Only a single analog-in pin is used and the shield uses a voltage divider to send a voltage that corresponds to a given key. To detect a key, one has only to read the voltage at the analog pin and determine if it falls within a certain range. For example, a voltage of 0 to 0.7 V signals the UP key was pressed. The DFR_Key library contains a getKey() function that does this and returns an integer from 0 to 5 that represents the key pressed (0 is supposed to mean no key, but as written means the last key was just released).

You’d expect that when you call getKey() it would read the voltage at the pin, figure out what key that represented, and send back the integer representing the particular key. So really, it should just be translating the voltage to an integer from 0 to 5 (none, select, left, up, down, right, respectively). But, there is some “extra functionality” the library provides that is the problem. Here’s how the logic of the getKey() function works:

Has a minimum time passed since the last time I checked for a key press?

If not, do nothing – return no value at all!

If so, read the voltage at the pin. Is this voltage different than the voltage I read the last time I checked for a keypress?

If not, return -1.

If they’re different, it means a key was pressed right? Determine which key was pressed and return an integer from 0 to 5 representing that key.

The first bit of “extra functionality” is what the library refers to as the refreshRate. The idea is that you don’t want to check for a key press too quickly, else the function might return that the key is being held down when in fact it’s just a normal press. This makes some sense if you simply dump a getKey() call in your Arduino sketch’s loop() function. You would then check the returned value to see if it actually did a key press. If it decided enough time hadn’t pass it would return….oh wait! It doesn’t return anything in this case. That’s not appropriate behavior. When the program says getKey(), it should expect a key code sent back. Therefore, it should be the job of the programmer to only call getKey() at appropriate intervals (say every 100 ms).

That brings up the next problem. There are five keys on the keypad. Add in an extra code for “no key being pressed” and you get the six integers from 0 to 5. Perfectly reasonable. So what’s this -1 return value for? The library defines the alias SAMPLE_WAIT for this value (as opposed to NO_KEY, and UP_KEY, etc.). I’m not sure what the meaning was supposed to be, but this value is returned when the getKey() function determines that the key being pressed is the same as the key that was detected upon the last call to getKey(). At first, it would seem to be letting you know that the last key pressed is being held down. But 1: you don’t know what the last key pressed was, unless you’re tracking it yourself. And 2: that may not even be true – if you make two getKey() calls 60 s apart, whose to say whether the key was being held the whole time; all we know is that the same key was pressed as last time. So it’s telling us the same key was pressed as before and according to point 1, I’m keeping track of what that key was. If it had just returned the actual key code, I could have figured this out for myself by comparing it to my stored value of the last key pressed.

Now to the final problem. If you follow the logic stated above carefully, you’ll see that to determine if the same key was pressed, the getKey() function compares the voltage read at the analog pin to the voltage it read last time it detected a key was pressed. But the voltage does not directly correspond to a given key – a key press can be signaled by a range of voltages. For example, assume on the first call to getKey() it reads a value of 200 mV. That corresponds to the UP_KEY and it returns 3. On the next call to getKey() assume it reads a value of 205 mV. The user is pressing the up key again (or holding it down) but the voltage is slightly different. The getKey() function compares the new value, 205 mV, to the old value, 200 mV, and thinks a new key is being pressed. So instead of returning -1 for “same key is being pressed” it returns 3 for “up key is being pressed”.

Actually, this should be the behavior! Upon every call, the getKey() function should just return an integer representing the key that is being pressed at the time the call is made. But because the authors meant for it to return -1 when there was no change in the key being pressed, and meant for it to be called on every loop() iteration, the Key_Grab demo flickers the screen like crazy. Actually, it works fine when the UNO board is removed from all sources of noise and interference. But put it next to a piece of electronics (e.g. your computer) and the noise causes the voltage supplied to the analog pin to fluctuate, new key presses to be registered, and the demo to update the screen on every loop() iteration. It’s the constant updating that causes the flicker which makes it appear as though you got ripped off $10.

How can we fix this mess? Actually, the fixes are simple and actually reduce the code in the library.

  1. Remove all of the logic relating to the “refreshRate”. The programmer will be forced to decide how often to call getKey().
  2. Remove the comparison of the current key press to the previous key press. The programmer can decide if the user is pressing the same key by recording the last pressed key.

Here is the derived library which I’ve called LCD_Keypad_Reader.cpp (feel free to rename). The original SainSmart DFR_Key library didn’t come with a license so I’m not putting one on this derived work either. I don’t really care what you do with this code, but it’s possible that SainSmart could impose some kind of limitations.

#include "Arduino.h" 
#include "LCD_Keypad_Reader.h" 

static int DEFAULT_KEY_PIN = 0;  
static int DEFAULT_THRESHOLD = 5; 

// The Sainsmart keypad uses a voltage divider to deliver a voltage  
// between 0 and 5 V that corresponds to the key being pressed in  
// order to use only a single input pin. The values below are from 0 to  
// 1023 because the Arduino uses a 10 bit resolution. 
static int UPKEY_ARV = 144; // 0.720 V, that's read "analogue read value" 
static int DOWNKEY_ARV = 329; // 1.645 V 
static int LEFTKEY_ARV = 505; // 2.525 V 
static int RIGHTKEY_ARV = 0; // 0 V 
static int SELKEY_ARV = 742; // 3.710 V 
static int NOKEY_ARV = 1023; // 5.115 V 

LCD_Keypad_Reader::LCD_Keypad_Reader() 
{     
  _keyPin = DEFAULT_KEY_PIN; 
  _threshold = DEFAULT_THRESHOLD; 
  _curInput = NO_KEY; 
  _curKey = NO_KEY; 
} 

int LCD_Keypad_Reader::getKey() 
{ 
  _curInput =  analogRead(_keyPin); 
  _curKey = categorizeKey(_curInput); 
  return _curKey; 
} 

int LCD_Keypad_Reader::categorizeKey(int analogKeyValue){ 
  int categorizedKeyValue = 0; 

  if (analogKeyValue > UPKEY_ARV - _threshold && analogKeyValue < UPKEY_ARV + _threshold ){ 
      categorizedKeyValue = UP_KEY; 
  } 
  else if (analogKeyValue > DOWNKEY_ARV - _threshold && analogKeyValue < DOWNKEY_ARV + _threshold ){ 
      categorizedKeyValue = DOWN_KEY; 
  } 
  else if (analogKeyValue > RIGHTKEY_ARV - _threshold && analogKeyValue < RIGHTKEY_ARV + _threshold ){ 
      categorizedKeyValue = RIGHT_KEY; 
  } 
  else if (analogKeyValue > LEFTKEY_ARV - _threshold && analogKeyValue < LEFTKEY_ARV + _threshold ){  
      categorizedKeyValue = LEFT_KEY; 
  } 
  else if (analogKeyValue > SELKEY_ARV - _threshold && analogKeyValue < SELKEY_ARV + _threshold ){ 
      categorizedKeyValue = SELECT_KEY; 
  } 
  else{ 
    categorizedKeyValue = NO_KEY; 
  } 

  return categorizedKeyValue; 
}

And here is the header file, LCD_Keypad_Reader.h

#ifndef LCD_Keypad_Reader_h 
#define LCD_Keypad_Reader_h 

#include "Arduino.h" 

#define SAMPLE_WAIT -1 
#define NO_KEY 0 
#define UP_KEY 3 
#define DOWN_KEY 4 
#define LEFT_KEY 2 
#define RIGHT_KEY 5 
#define SELECT_KEY 1 

class LCD_Keypad_Reader 
{ 
  public: 
    LCD_Keypad_Reader(); 
    int getKey(); 
    int categorizeKey(int); 
  private: 
    int _keyPin; 
    int _threshold; 
    int _curInput; 
    int _curKey; 
}; 

#endif